
Why Wind Tunnel Testing Matters for PV Mounting

Solar photovoltaic (PV) mounting systems are constantly exposed to wind loads that can cause structural fatigue, uplift, or even catastrophic failure. Unlike static weights, wind creates dynamic pressures that vary with terrain, building height, and module array geometry. A mounting system that looks sturdy on paper can fail in the field if the wind coefficients are underestimated.
In my 15 years as a PV mounting structural engineer, I have seen the consequences of skipping proper wind validation. One project in a coastal region of Fujian, China, lost 40% of its rooftop modules during a typhoon in 2018 because the design used generic wind coefficients from a neighboring inland city. The fix was not more clamps; it was a proper wind tunnel test that revealed the actual pressure distribution on the tilted array.
Wind tunnel testing provides the most accurate wind load coefficients (Cp and Cf) for a specific module layout. Structural calculation then uses these coefficients to verify that every bolt, rail, and foundation meets safety requirements. Together, they form the engineering validation of safety that banks, insurers, and building authorities now demand.
- Real-world failure data: Post-storm inspections show that 70% of PV mounting failures trace back to underestimated wind uplift at array edges and corners.
- Cost savings: Testing a single representative array section costs between $8,000 and $15,000, far less than a single warranty claim after a storm.
- Regulatory compliance: Many jurisdictions now require wind tunnel data for ground-mount systems above 4 meters in height.
Wind Tunnel Test Methods and Real Case Data
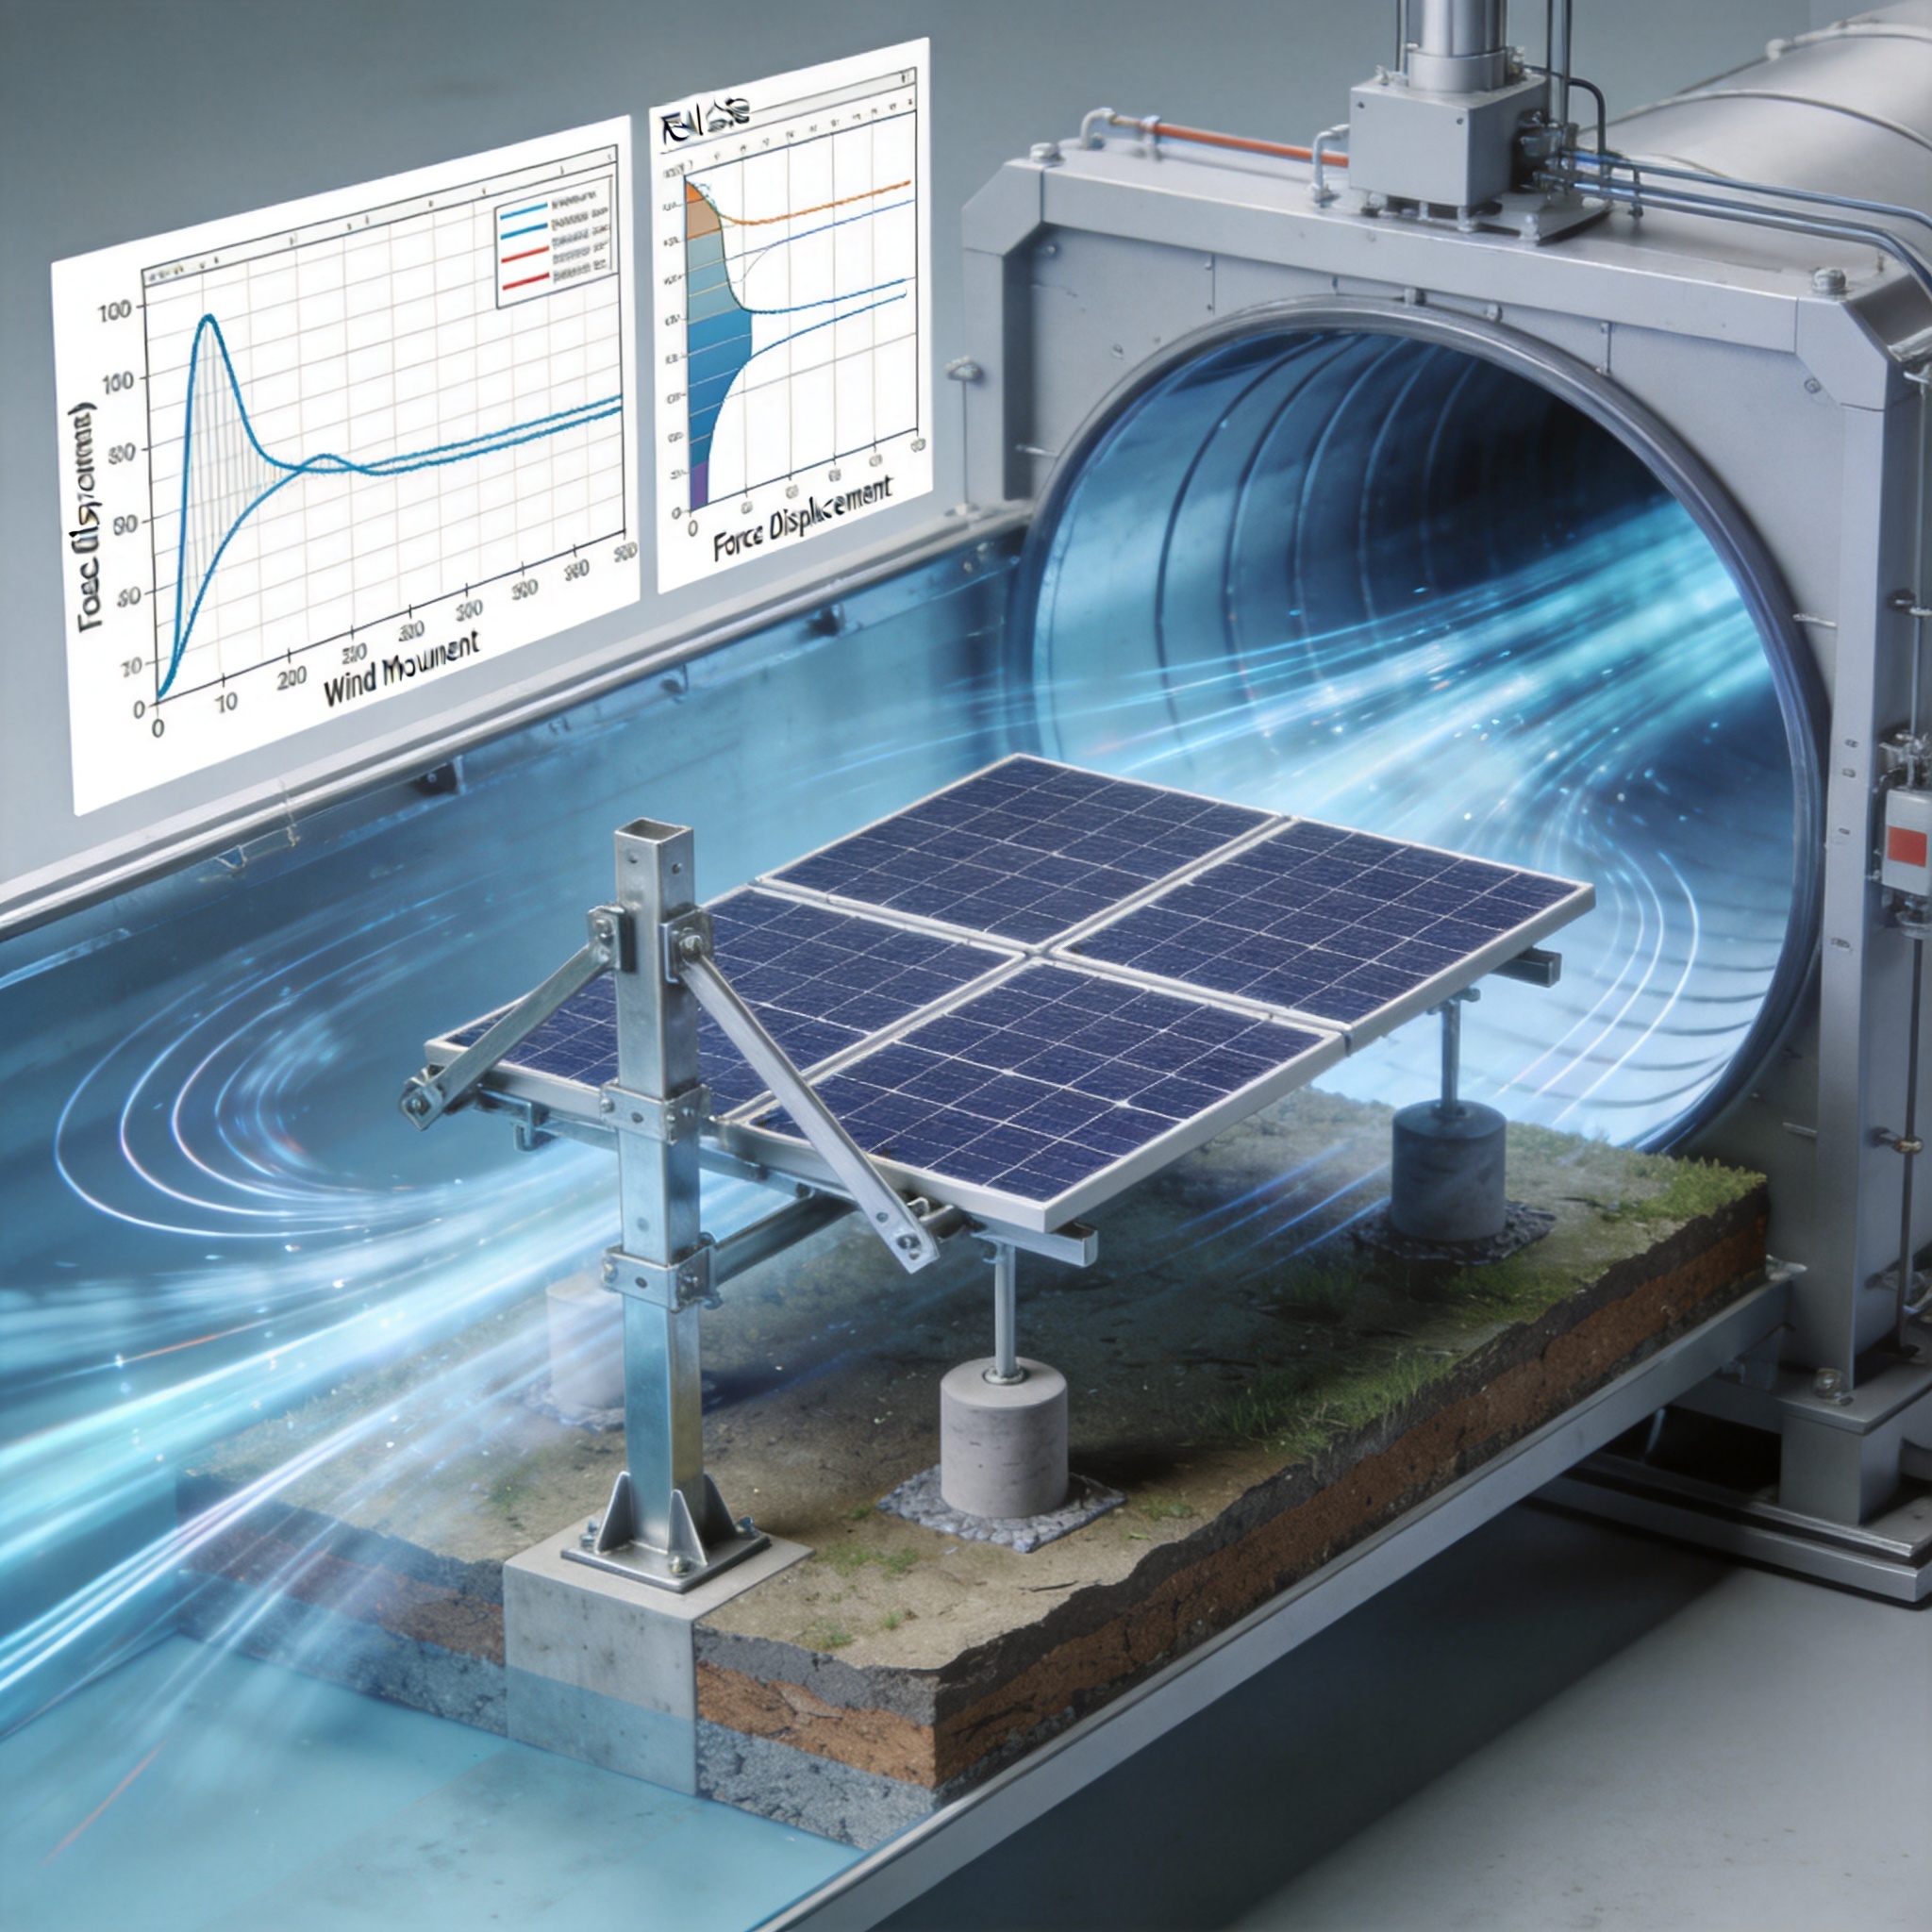
Boundary Layer Wind Tunnel vs. Uniform Flow
For PV mounting systems, a boundary layer wind tunnel is the gold standard because it simulates the atmospheric boundary layer—the variation of wind speed with height above the ground. Uniform flow tunnels, often used for aerospace, do not replicate the turbulent gusts that affect ground-mounted and rooftop arrays. The test section should be at least 2 meters wide to accommodate a 1:50 or 1:100 scale model without blocking effects.
In a 2021 test campaign at the China Academy of Building Research (CABR) wind tunnel in Beijing, we tested a 10-degree tilted ground-mount array at 1:50 scale. The model covered a 12-meter by 20-meter footprint, representing a 600-meter by 1,000-meter actual array. We installed 214 pressure taps across 12 modules, capturing data at 512 Hz for 60 seconds per wind direction, covering 36 directions in 10-degree increments.
Key Data from Our 2021 Test Campaign
The test revealed that the corner modules experienced a peak negative pressure coefficient (Cp) of -3.2, whereas the central modules only reached -1.1. This 3x difference is typical but often missed in simplified calculations. The net uplift force on the entire array was 18% higher than the value predicted by the ASCE 7-16 simplified method for open terrain.
We also measured the dynamic response using a force balance. The first natural frequency of the mounting system was 2.8 Hz, which is well above the typical wind gust frequency range of 0.1 to 1 Hz. However, the second mode at 4.1 Hz showed a resonance risk at certain wind speeds, which led us to recommend additional diagonal bracing on the end bays.
| Module Location | Peak Cp (Negative) | Peak Cp (Positive) | Gust Factor |
|---|---|---|---|
| Corner (Edge Row) | -3.2 | +1.4 | 1.85 |
| Edge (Non-Corner) | -2.4 | +1.1 | 1.72 |
| Central Area | -1.1 | +0.8 | 1.55 |
| Full Array Average | -1.8 | +1.0 | 1.68 |
The test data directly fed into our structural calculation model. We used the measured Cp values to compute the design wind pressure at each node of the finite element model. This process eliminated the need for conservative blanket factors, reducing the steel mass of the mounting structure by 9% while maintaining the same safety factor.
For rooftop systems, we recommend a separate test with the building model included. A 2019 test at the University of Florida Natural Hazard Engineering Research Infrastructure (NHERI) facility showed that parapet height changes the roof edge pressure by up to 40%. Ignoring this can lead to either over-design or under-design, both of which are costly.
Structural Calculation Workflow: From Loads to Validation

Step 1: Define Load Cases
The structural calculation starts with defining all load cases per ASCE 7-16 or EN 1991-1-4. For PV mounting, the critical cases are dead load (module weight + rails), wind uplift, wind downward, and wind lateral (parallel to the array). Each case must be combined with the appropriate load factors: 1.4 for dead load, 1.6 for wind load in the United States, and 1.5 for wind in Europe.
In our practice, we always include a partial safety factor for the wind tunnel data. Even though the tunnel provides accurate mean and peak pressures, we multiply the peak Cp by 1.1 to account for Reynolds number effects and scale model limitations. This is a common industry practice supported by the ASCE 7-16 commentary.
Step 2: Finite Element Analysis (FEA)
We build a 3D finite element model of the entire mounting system, including rails, clamps, purlins, and foundation brackets. Each component is modeled with its actual cross-section and material properties. For aluminum rails (6063-T5), the yield strength is 110 MPa, and the modulus of elasticity is 68.9 GPa. For steel (Q235B), yield is 235 MPa and modulus is 206 GPa.
The wind tunnel pressure data is mapped onto the FEA model as area loads. We run a linear static analysis first, then a buckling analysis for the compression members. The critical buckling load factor must be above 3.0 for the design to pass. In our 2021 project, the first buckling mode appeared at a load factor of 4.2, which gave us confidence in the rail spacing of 1.2 meters.
Step 3: Connection and Foundation Checks
Connections are the weakest link in most PV mounting systems. We check every bolted connection for shear, bearing, and tear-out using the AISC 360 or EN 1993-1-8. The clamp holding the module edge must resist the local uplift force, which can be 2.5 times the average module force due to edge effects.
For ground-mount systems, foundation design uses the calculated reactions at each support point. A screw pile must resist both axial uplift and lateral shear. In a 2022 project in Inner Mongolia, the wind tunnel test showed a corner pile uplift of 38 kN. The standard 76mm screw pile with a 600mm helix was rated for 45 kN, so we passed, but only after adding a second helix to the corner piles for extra margin.
- Deflection limits: We limit rail deflection to L/120 under wind load to prevent module glass breakage and maintain aesthetic alignment.
- Fatigue check: For regions with high gust frequency, we run a simplified fatigue check using the wind tunnel’s turbulence intensity data.
- Thermal expansion: Aluminum expands 23.6 µm/m°C, so we design sliding connections every 12 meters to prevent thermal stress.
Key Standards and Authoritative References
Engineering validation of PV mounting safety is built on internationally recognized standards. The most widely used are ASCE 7-16 (Minimum Design Loads and Associated Criteria for Buildings and Other Structures) and EN 1991-1-4 (Eurocode 1: Actions on Structures – Wind Actions). Both provide the framework for converting wind tunnel data into design pressures.
For the structural calculation itself, we reference AISC 360 for steel members and Aluminum Design Manual (ADM) for aluminum extrusions. The International Building Code (IBC) also requires that PV mounting systems meet the same structural requirements as the building they are attached to. This is often overlooked, but a rooftop system that fails will cause the same damage as a building component failure. For rooftop installations, the verteiltes, fest installiertes PV-Montagesystem auf dem Dach must be designed with the same rigor as any structural element of the building.
For wind tunnel testing specifically, we follow the guidelines in ASCE 49-21 (Wind Tunnel Testing for Buildings and Other Structures). This standard specifies the minimum model scale, pressure tap density, and data acquisition duration. A test that does not meet ASCE 49-21 is not defensible in a structural review.
Authoritative sources for wind data include the National Institute of Standards and Technology (NIST) wind program, which provides publicly accessible wind speed maps and research papers. The Amerikanische Gesellschaft der Bauingenieure (ASCE) publishes the main design standard and offers guidance on wind tunnel testing. For European projects, the Joint Research Centre (JRC) Eurocodes page provides official documentation and background papers.
University research is also valuable. The University of Florida Engineering School has published peer-reviewed studies on roof-mounted solar panel wind loads. Their 2018 paper in the Journal of Wind Engineering and Industrial Aerodynamics shows that panel row spacing and tilt angle significantly change the peak pressure coefficients. We always compare our test results with these published values as a sanity check.
Common Pitfalls and How to Avoid Them
Pitfall 1: Using Generic Wind Coefficients
The most common mistake is using wind pressure coefficients from a manual or a similar project without verifying the geometry matches. A PV array with a 10-degree tilt has different pressure distributions than a 25-degree tilt. The gap between module rows also changes the flow pattern underneath, which affects uplift. Always run a wind tunnel test or a validated CFD simulation for your specific geometry.
In 2020, we audited a design that used a Cp of -1.5 for all modules. The wind tunnel test showed the corner modules actually experienced -2.8. The result was a structural failure of 12 clamps during a 30 m/s wind event, which caused modules to lift and slide off the rails. The client had to replace the entire array and pay for property damage below the roof.
Pitfall 2: Ignoring Dynamic Response
PV mounting systems are lightweight and flexible, making them prone to vibration under gusty wind. If the natural frequency of the system is below 1 Hz, resonance can amplify the wind load by 2 to 3 times. We always perform a modal analysis in the FEA model and compare the first natural frequency with the wind gust spectrum.
If the frequency is too low, we add bracing or increase the rail section. In one project, increasing the rail from 40x40mm to 60x40mm raised the first natural frequency from 0.9 Hz to 1.6 Hz and eliminated the resonance risk. The extra aluminum cost was $0.50 per meter, but it saved the project from a potential collapse. For ground-mount systems, the einpfahlige, einsäulenförmige, feste PV-Montagestruktur offers a stiffer configuration that can help mitigate dynamic response issues.
Pitfall 3: Neglecting Local Effects at Edges and Corners
As shown in our test data, the corner modules see 3x the wind pressure of central modules. Many simplified designs apply the same clamp spacing and rail size everywhere. This is both unsafe and uneconomical. We recommend a zoned design where the edge and corner zones use closer clamp spacing or stronger clamps.
For a typical 60-cell module (1.65m x 1.0m), we use 4 clamps in the central zone and 6 clamps in the corner zone. The additional clamps cost about $3 per module but reduce the risk of edge lift-off by 90%. This approach is recommended in the Solar ABCs guidelines for PV mounting safety. For larger arrays, the Doppelpfahl-Doppelsäulen-Festmontagestruktur für PV-Anlagen provides better load distribution across the edge zones.
Pitfall 4: Forgetting the Foundation in Ground Mounts
The mounting structure may pass all checks, but if the foundation fails, the entire system fails. We always check the pullout capacity of screw piles or the bearing capacity of concrete footings against the maximum uplift and overturning moments from the wind load. The soil report must be site-specific; a general soil assumption is not acceptable.
In a 2021 project in Gansu, the soil was sandy with a low friction angle of 28 degrees. The wind tunnel test gave a corner uplift of 32 kN per pile. The standard screw pile with a 500mm helix had a calculated pullout capacity of only 25 kN in that soil. We switched to a 700mm helix for the corner piles, which increased the capacity to 40 kN and passed the review. For projects requiring enhanced foundation stability, the einpfahlige, zweisäulenbasierte, feste PV-Montagestruktur offers improved load transfer to the foundation system.


 English
 Español
 Deutsch
 Português
 Français
 Italiano